技术应用白皮书
条形液晶显示技术
通过以下方式改变零售环境
高影响力视觉传达解决方案
编制单位:产品工程部;解决方案团队
文件版本:3.2 |出版日期:2026年第2季度
分类:公共-用于客户分销
 执行摘要
执行摘要
全球零售业正在经历一场根本性的转型,这是由数字技术的融合、消费者期望的演变和对客户注意力的激烈竞争所驱动的。在这种动态环境中,在决策点提供有针对性、视觉上引人注目的内容的能力已成为所有细分市场零售商的关键差异化因素。
拉伸条形液晶显示器代表了对这一挑战的专门设计。结合超宽纵横比(通常为16:3或32:9)、高亮度光学性能和适合24/7商业运营的坚固结构,这些显示器越来越多地被部署为现代零售数字标牌策略的基石。
本白皮书对以下内容进行了全面的技术和商业分析 拉伸条液晶显示器 技术,检查其架构原理、性能特征、部署方法,并展示了关键零售垂直领域的投资回报。它旨在为零售技术总监、视觉营销经理和采购专家评估下一代店内展示基础设施提供决策支持资源。
研究表明,数字销售点显示器根据产品类别将平均交易价值提高了15-40%,由于其独特的外形和货架边缘的接近,拉伸条格式的召回率特别高。
1.市场背景和;行业驱动因素
1.1不断演变的零售展示格局
传统的静态货架边缘标签和印刷POP材料越来越不足以满足现代零售环境的需求。消费者希望在每个接触点都能获得动态、个性化和上下文相关的信息,而零售商则需要灵活性,以便在分布式商店网络中实时更新定价、促销和产品内容。
2023年,全球数字标牌市场的价值约为251亿美元,预计到2030年将超过450亿美元,这得益于零售、酒店和交通垂直行业的加速采用。在这个市场中,随着零售商从通用的消费级屏幕转向为特定商业用例设计的解决方案,专用的零售展示形式因素(包括拉伸条、货架边缘和超宽格式)是增长最快的细分市场之一。
1.2关键业务驱动因素
几个宏观层面的力量正在推动对条形LCD基础设施的投资:
• 全渠道整合:零售商正在投资店内数字接触点,以反映电子商务的个性化和动态性,缩小实体渠道和数字渠道之间的体验差距。
• 定价灵活性:供应链波动、通货膨胀动态和竞争性定价压力要求静态标签无法支持的近乎实时的价格管理能力。
• 可持续性要求:ESG承诺正在加速淘汰印刷宣传材料,数字显示器可显著减少纸张消耗和浪费。
• 劳动效率:连接到拉伸条形显示网络的集中式内容管理系统大大降低了与手动价格和促销更新相关的劳动力成本。
• 数据驱动的商品销售:将展示网络与分析平台集成,可以在单个夹具级别对促销内容、分日策略和绩效衡量进行A/B测试。
2.技术架构与;显示器基础
2.1外形尺寸定义和;光学几何
拉伸条LCD显示器的特点是其极端的纵横比,通常在7:1到32:3之间,这产生了一种针对货架边缘、橱柜下方和面向过道的安装进行优化的水平条格式。常见的面板分辨率包括1280×360、1920×540和3840×1080像素,物理对角线通常在14到58英寸之间。
拉伸显示器的光学几何形状旨在最大限度地提高水平视角,这对于面向过道的零售安装至关重要,同时保持整个面板宽度的垂直亮度均匀性。先进的光学粘合技术消除了LCD面板和前玻璃之间的气隙,大大减少了内部反射,提高了高环境光零售环境中的对比度。
2.2技术规格概述
下表总结了商用级拉伸条液晶显示器的关键性能参数:
面板技术 | IPS(平面内切换)或VA(垂直对齐)LCD |
宽高比 | 7:1、16:3、32:9、32:3(可定制比例) |
本地决议 | 1280×360/1920×540/3840×1080像素 |
屏幕尺寸 | 14特此;";19农业;”;,23栽培;”;,28农业;”;37农业;”;47农业;”;58农业;”;对角线 |
亮度(标准) | 400–700 cd/m²(尼特) |
亮度(高亮度) | 1000–2500 cd/m²(室外/高环境) |
对比度 | 1000:1至4000:1(静态);上限为50000:1(动态) |
色域 | 72-90%的NTSC;sRGB已校准 |
视角 | 178°H/178°V(IPS面板) |
工作温度 | -20°C至+60°C(扩展:-40°C至+70°C,带热管理) |
营业时间 | 50000-100000小时MTBF |
防护等级 | IP42(标准)至IP65(室外/冲洗级) |
输入接口 | HDMI 2.0、DisplayPort 1.4、USB-C、RJ45(局域网)、RS232 |
星上处理 | 安卓11/12 SoC或Windows IoT可选集成播放器 |
功耗 | 12W–65W,取决于尺寸和亮度 |
认证 | CE、FCC、RoHS、UL、能源之星(部分型号) |
2.3集成与外部媒体播放器架构
拉伸条形显示器有两种主要的系统架构,每种架构都有不同的优势,具体取决于部署规模和管理要求:
2.3.1片上系统(SoC)集成播放器
SoC集成模型将媒体播放器直接嵌入显示单元,消除了对外部硬件的依赖。集成SoC通常提供1.8-2.0 GHz的四核ARM处理,2-4 GB RAM和16-32 GB eMMC存储。这种架构减少了安装占地面积,降低了总体拥有成本,并简化了高密度部署中的维护。
2.3.2外部播放器架构
需要更密集内容处理的安装(如4K视频播放、实时数据集成或AI驱动的内容个性化)受益于外部播放器配置。基于Intel NUC或NVIDIA Jetson平台的外部播放器提供了更大的计算资源,实现了高级分析、用于受众测量的面部检测和复杂的CMS集成。
2.4热管理和;可靠性工程
24/7零售环境的操作需求对显示硬件提出了严格的热管理要求。商用级拉伸条显示器包含多区域热监测、变速风扇系统(或密封单元中的无风扇被动冷却)和自动亮度调节,以将面板温度保持在验证的工作范围内。
加速寿命测试协议验证了面板在50000-100000个工作小时内的性能,MTBF数据独立通过了IEC 60068环境测试标准的认证。这种工程严谨性意味着在典型的零售部署中,年化故障率远低于1%,从而最大限度地降低了更换成本和面向客户的显示器停机时间。
3.零售应用场景
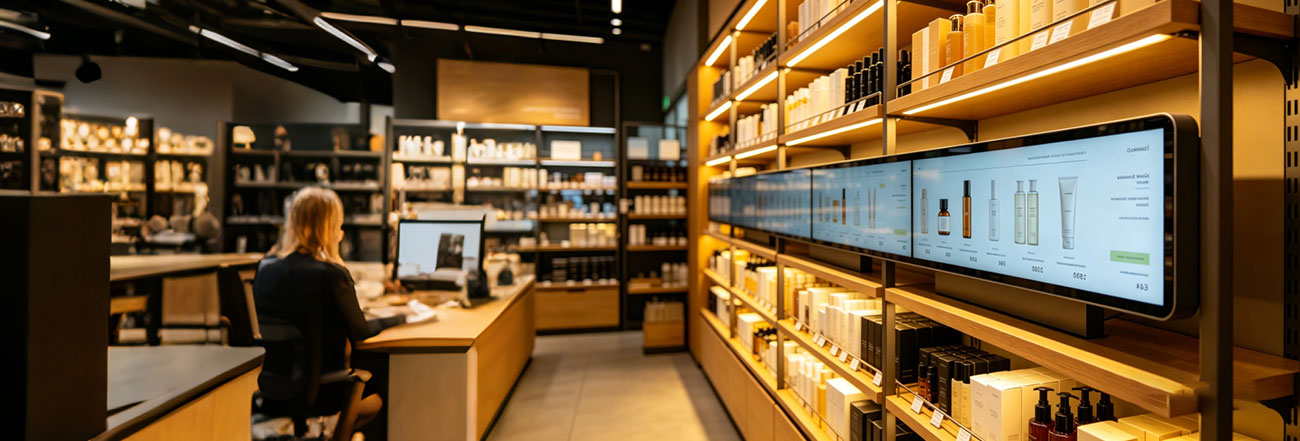
3.1货架边缘电子货架标签(ESL)的更换和;增强
在食品零售、药店和消费电子产品中,拉伸条显示器最常见的部署是作为动态货架边缘标签。与仅限于最小文本和数字内容的传统ESL系统不同,拉伸条形显示器在产品选择时支持全动态视频、动画图形和格式丰富的促销信息。
部署通常涉及19个";-28";对角线单元水平安装在货架正面,可以表面安装在标准吊舱立柱上,也可以集成到定制的货架系统中。与POS和库存数据库同步的内容管理系统实现了自动价格更新、缺货指标和促销激活,无需员工干预。
一家领先的欧洲杂货连锁店在320家门店部署了拉伸条形货架边缘显示器,在运营的前12个月内实现了97.3%的定价准确率(手动标签管理为91.2%),促销合规错误减少了23%。
3.2队列管理和;结账区参与度
结账区和排队区代表了停留时间较长的地方,拉伸的条形显示器会产生巨大的参与度影响。这些显示器安装在传送带上方,与排队障碍物齐平,或集成在自助结账亭周围,在关键的预付款时刻提供最后一次购买建议、忠诚度计划信息和品牌传播。
条形显示器的窄垂直占地面积使其特别适合空间受限的结账环境,在这种环境中,天花板高度和视线因素限制了传统方形屏幕的实际安装。
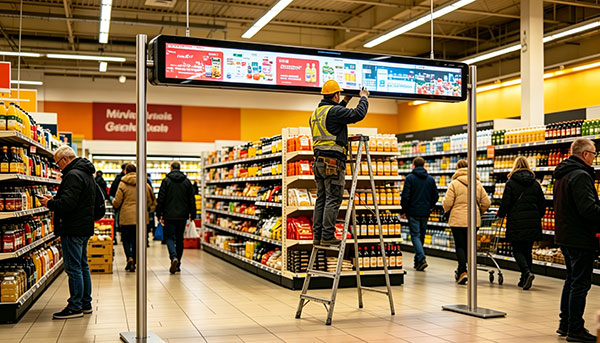
3.3端盖和;类别入口标识
缆车端盖和品类入口点是品牌和促销传播的主要场所。 拉伸条形显示器这些位置具有双重功能:作为从远处可见的吸引注意力的动态标牌,以及作为近距离提供产品比较、食谱内容或品牌故事的信息显示器。设施通常使用37英寸;-58";横向的对角线单位,通常是多屏幕垂直堆叠,以创建更大的视觉画布。
3.4时尚零售:Rail Top&;试衣间应用
在服装和时尚零售领域,安装在服装轨道上方的拉伸条形显示器为品牌视频、画册内容和护理说明提供了一种优雅、节省空间的解决方案。水平格式反映了服装轨道本身的比例,创造了一个视觉上连贯的显示环境,而没有传统屏幕的侵入性足迹。
试衣间应用程序使用安装在镜子上方或集成在门板上的显示器,提供由RFID标签服装触发的个性化造型建议,或在高考虑试穿时刻展示加强高端定位的品牌内容。
3.5汽车零售和;经销商展厅
汽车经销商正在沿着汽车发动机罩线和门槛部署拉伸条形显示器,以显示实时定价、融资计算器和车型规格比较。外形尺寸与车辆比例自然匹配,创建了一个集成的数字信息层,在不破坏车辆本身视觉呈现的情况下增强了高级展厅的体验。
4.内容管理系统集成
4.1企业CMS架构
大规模有效部署拉伸条显示网络需要强大的CMS基础设施,能够管理数百或数千个端点的内容分发、调度和监控。为零售数字标牌设计的企业CMS平台通常提供:
• 支持区域、商店、地区和网络级定位的分层内容组织
• 基于角色的访问控制,使商店经理、区域团队和中央营销部门能够保持适当的内容权限
• 实时设备健康监测,自动提醒显示故障、连接丢失或内容播放错误
• 带有时间戳精确回放日志的播放证明报告,用于促销合规文档
• API-first架构,实现与ERP、PIM、POS和忠诚度管理系统的集成
4.2数据集成模式
当从实时业务数据源动态生成内容时,拉伸条显示网络的操作价值最大化。以下集成模式通常在企业零售部署中实现:
集成类型 | 数据源 | 内容输出 | 更新频率 |
价格馈送集成 | ERP/POS系统 | 动态价格叠加 | 实时/接近实时 |
库存状态 | WMS/库存系统 | 可用性指标 | 每15-60分钟 |
促销管理 | 贸易促进管理 | 促销创意 | 活动已安排 |
天气触发因素 | 天气API | 情境产品追加销售 | 每小时 |
受众分析 | 店内摄像头AI | 目标内容变体 | 实时 |
忠诚度整合 | CRM平台 | 个性化优惠 | 会话已触发 |
4.3网络基础设施要求
稳定和低延迟的网络连接是可靠的CMS管理显示操作的基本前提。建议企业级部署使用以下基础设施规范:
• 标准清晰度内容每50个显示端点至少10 Mbps专用带宽
• 千兆以太网骨干网支持PoE+(IEEE 802.3at),简化了安装,电源和数据可以共享一条电缆
• VLAN分段将显示网络流量与公司和POS系统隔离开来
• 存储级别的本地边缘缓存服务器,以最大限度地减少对广域网的依赖,并确保连接中断期间的内容可用性
• 802.11ac(Wi-Fi 5)或802.11ax(Wi-Fi 6)无线,适用于有线基础设施不切实际的安装
5.部署方法和;最佳实践
5.1现场调查和;安装规划
拉伸条显示系统的成功部署始于全面的现场调查,记录结构安装表面、可用电源电路、数据网络接入点、环境光照水平和客户流量模式。这些调查为显示器放置、亮度规格和内容策略决策提供了信息,这些决策决定了最终安装的有效性。
关键的现场调查参数包括在不同交易时间测量安装点的环境照度(lux),评估可能影响对比度性能的直射阳光或高强度聚光灯,以及天花板或高架安装配置的结构载荷分析。
5.2安装系统和;集成硬件
拉伸条形显示器设计用于与各种安装和固定系统集成:
• 标准VESA安装兼容性(75×75mm至200×200mm),实现通用支架兼容性
• 定制的缆车集成支架,配备免工具电缆管理,专为杂货店和大众零售环境设计
• 薄型表面安装型材,带集成电缆通道,便于齐平安装
• 用于架空过道安装的吊顶安装系统
• 自助服务和交互式显示配置的Kiosk集成套件
5.3调试和;质量验证
安装后调试应根据项目验收标准验证以下性能参数:
• 面板亮度均匀性:在9个点测量的显示表面最大±15%的变化
• Color temperature consistency: ±200K deviation from specified white point (typically 6500K)
• CMS connectivity: confirmed registration of all endpoints within the management platform
• Content playback verification: full playlist cycle confirmed on each display
• Viewing angle validation: content legibility confirmed at specified maximum viewing distances and angles
6. Return on Investment Framework
6.1 Revenue Impact Metrics
Quantifying the commercial impact of stretched bar display investments requires a structured measurement framework that captures both direct revenue uplift and indirect operational efficiencies. The following metrics framework is recommended for retail deployment evaluation:
KPI Category | Metric | Typical Improvement Range | Measurement Method |
Revenue | Promoted item sales uplift | +15% to +40% | A/B store comparison |
Revenue | Average basket value | +3% to +12% | POS transaction analysis |
Revenue | Conversion rate (category) | +5% to +18% | Traffic counter + POS |
合规 | Promotional pricing accuracy | +6% to +15% pts | Price audit sampling |
Efficiency | Promo label labor reduction | 60%–80% hours saved | Labor time study |
Efficiency | Price update cycle time | Hours → Minutes | Process timing |
Sustainability | Print material elimination | 70%–95% reduction | Print volume tracking |
6.2 Total Cost of Ownership Analysis
A comprehensive TCO analysis for a 100-store deployment of stretched bar displays across a typical grocery network (average 40 units per store) illustrates the financial case:
• Hardware acquisition: $280–$420 per display unit (23" SoC-integrated, commercial grade)
• Installation labor: $85–$150 per unit for standard gondola integration
• CMS licensing: $0.50–$1.20 per display per month for cloud-managed enterprise platform
• Network infrastructure: $2,500–$8,000 per store for Ethernet cabling and edge hardware
• Annual maintenance: 8–12% of hardware cost (comprehensive parts-and-labor contract)
Against these costs, a retailer managing 40 displays per store with weekly promotional updates can anticipate labor savings equivalent to 3–5 FTE hours per store per week at current wage rates, yielding annualized labor savings that typically recover hardware investment within 18–30 months in medium-density deployments.
Independent lifecycle analysis across 12 retail deployments managed by our solutions team demonstrated a median payback period of 22 months, with five-year NPV exceeding 3.2× the initial capital investment when accounting for combined revenue uplift and operational savings.
7. Application Case Studies
7.1 Case Study: European Hypermarket Chain – Shelf-Edge Digitization
Sector: Food Retail | Deployment Scale: 180 stores | Display Count: 14,400 units
Challenge: A major hypermarket operator with stores across seven European markets was experiencing significant promotional compliance failures, with an estimated 8.5% of shelf positions displaying incorrect pricing or outdated promotional materials at any given time. Manual label management across 80,000+ SKUs was consuming approximately 2,400 labor hours per week across the store network.
Solution: Deployment of 23" stretched bar LCD displays integrated with the retailer's SAP-based ERP system via a purpose-built CMS connector. Real-time price feed synchronization ensured display content updated within 90 seconds of any ERP price change. Motion-triggered promotional content activated consumer attention during periods of peak foot traffic.
Outcomes after 18 months of operation:
• Pricing compliance improved from 91.5% to 98.7%
• Promotional labor reduced by 1,850 hours per week across the network
• Average basket value on featured categories increased 19.3%
• Carbon footprint reduction: 84 metric tons of paper consumption eliminated annually
7.2 Case Study: Premium Electronics Retailer – Interactive Category Experience
Sector: Consumer Electronics | Deployment Scale: 42 flagship stores | Display Count: 1,260 units
Challenge: A premium consumer electronics retailer sought to differentiate its in-store experience from online competitors and mass-market retailers by delivering deeper product education and brand storytelling at the category level.
Solution: 37" stretched bar displays deployed in 3-unit vertical stacks at category entry points, integrated with product information management (PIM) system to deliver model comparison content, video reviews, and specification data. NFC-enabled interactive triggers allowed customers to pull detailed specification sheets to their smartphones.
Outcomes after 12 months:
• Product attach rate (accessories per transaction) increased 34%
• Average selling price on featured categories increased 11.2%
• Customer satisfaction scores (NPS) in relevant categories increased 18 points
• Staff product knowledge query volume reduced 28%, enabling reallocation to service activities
8. Sustainability & ESG Considerations
The transition from print-based retail communication to digital display networks delivers material environmental benefits that are increasingly relevant to corporate ESG reporting obligations. Key sustainability metrics associated with stretched bar display deployment include:
8.1 Materials & Waste Reduction
A typical 100-store grocery network consuming 2 million promotional labels annually generates approximately 8–12 metric tons of paper waste, plus chemical waste from label adhesives and printing consumables. Full digitization of shelf-edge communication eliminates this waste stream, with a corresponding reduction in supply chain carbon emissions from print production and distribution logistics.
8.2 Energy Efficiency Design
Contemporary commercial-grade stretched bar displays incorporate multiple energy optimization features:
• Ambient light sensors enabling automatic brightness adjustment to maintain visual performance while minimizing power consumption
• Schedule-based dimming aligned with store trading hours
• Intelligent sleep modes during non-trading periods with rapid wake capability
• LED backlight technology achieving energy consumption reductions of 60–70% compared to CCFL-backlit predecessors
At the system level, a 40-display store installation consuming an average of 25W per display (typical for 23" SoC units at 400 nit brightness) draws approximately 1 kW at full operation—comparable to a small number of fluorescent shelf-edge lighting fixtures and representing a minimal contribution to overall store energy consumption.
9. Vendor & Product Selection Criteria
Organizations evaluating stretched bar display solutions for retail deployment should apply the following structured evaluation framework to ensure technology selections meet both immediate deployment requirements and long-term strategic needs:
Evaluation Criterion | Key Assessment Questions | 重量 |
Panel Performance | Does brightness meet worst-case ambient light conditions? Is color uniformity validated? | 高 |
Reliability & MTBF | Are failure rate claims independently certified? What is the warranty and replacement SLA? | 高 |
CMS Compatibility | Does the display support your preferred CMS platform? Are APIs open and documented? | 高 |
Scalability | Can the vendor support full network deployment within required timelines? | Medium |
Technical Support | Is on-site support available in all required geographies? What are SLA commitments? | Medium |
Total Cost of Ownership | What is the fully loaded 5-year cost including hardware, installation, and support? | Medium |
Sustainability Profile | Are energy certifications current? Is end-of-life recycling supported? | Medium |
Future Roadmap | Is the vendor investing in next-generation features (AI content, touch, analytics)? | Low |
10. Emerging Technologies & Future Outlook
10.1 AI-Driven Content Personalization
The integration of edge AI processing with stretched bar display networks is enabling a new generation of context-aware content delivery. Computer vision systems analyzing anonymized customer presence and dwell time data can dynamically select and sequence content variants in real time, moving beyond static playlist scheduling to genuinely responsive in-store communication. Early deployments of AI-optimized content in retail environments are demonstrating engagement lifts of 25–45% compared to conventional dayparting-based scheduling approaches.
10.2 Transparent & Flexible Display Technology
Transparent OLED and MicroLED display technologies are beginning to emerge as premium alternatives for showcase and high-visibility retail applications. While current pricing limits deployment at scale, transparent displays integrated into refrigerator doors and product showcase cases represent a natural evolution of the stretched bar form factor into fully immersive display environments. Cost reduction trajectories suggest mainstream retail viability within 3–5 years.
10.3 Unified Commerce Analytics Integration
As retail organizations mature their data infrastructure, stretched bar display networks are increasingly positioned as active nodes in the unified commerce analytics ecosystem. Sensor fusion combining display audience measurement, dwell time analysis, and POS correlation is enabling granular attribution of in-store display investment to specific sales outcomes—a capability that brings digital signage investment justification to the same level of rigor as digital advertising performance measurement.
11. Conclusion & Recommendations
Stretched bar LCD display technology has matured from a niche format curiosity to a proven, enterprise-grade infrastructure component for retail visual communication. The convergence of purpose-engineered hardware, robust commercial-grade reliability, and sophisticated CMS integration capabilities has created a technology platform that delivers measurable, attributable business value across retail formats and categories.
For organizations evaluating investment in this technology, the following recommendations reflect best practice derived from successful large-scale deployments:
• Begin with a structured pilot program across 10–20 stores encompassing diverse format types, incorporating rigorous A/B comparison measurement before committing to full network rollout.
• Prioritize CMS platform selection and integration architecture before hardware procurement—the management system is the long-term value creator; the display hardware is its delivery mechanism.
• Specify commercial-grade hardware with validated MTBF ratings and comprehensive support SLAs; consumer-grade displays will not sustain 24/7 retail operational demands.
• Develop a content strategy framework before deployment, including templates, data integration specifications, and governance processes for content approval and scheduling.
• Establish baseline KPI measurements (basket value, conversion rate, promotional compliance, labor hours) prior to deployment to enable rigorous post-deployment impact quantification.
Organizations that approach stretched bar display investment with this level of strategic rigor consistently achieve the upper range of the ROI metrics documented in this paper, and position themselves to extract additional value as AI content optimization and unified analytics capabilities continue to mature.
To discuss deployment requirements, request reference site visits, or obtain a detailed commercial proposal for your organization's specific needs, please contact our retail solutions team. We bring extensive experience across food retail, fashion, consumer electronics, and automotive verticals to support your evaluation and deployment process.
Appendix A: Glossary of Technical Terms
宽高比 | The proportional relationship between display width and height. Stretched bar displays typically feature ratios of 7:1 to 32:3. |
Brightness (Luminance) | Measured in candelas per square meter (cd/m², commonly nits). Higher values are required in high ambient light environments. |
CMS | Content Management System. Software platform for creating, scheduling, and distributing content to display networks. |
对比度 | The ratio between the brightest white and darkest black a display can produce. Higher ratios indicate better visual depth. |
ESL | Electronic Shelf Label. A digitally managed label system for displaying pricing and product information at the shelf edge. |
IPS面板 | In-Plane Switching LCD panel technology offering wide viewing angles and accurate color reproduction. |
平均故障间隔时间 | Mean Time Between Failures. A reliability metric representing the average operating time expected between failures. |
Nits | Informal unit of luminance equivalent to cd/m². A standard retail display operates at 400–700 nits; high-bright models at 1,000–2,500 nits. |
PoE+ | Power over Ethernet Plus (IEEE 802.3at). Delivers up to 30W of power over standard network cabling, simplifying display installation. |
SoC | System-on-Chip. An integrated circuit that combines processor, memory, and I/O interfaces, enabling standalone media playback within the display unit. |
TCO | Total Cost of Ownership. Comprehensive cost analysis encompassing hardware, installation, software, maintenance, and operational costs over a defined period. |
VESA Mount | A standardized mounting interface (Video Electronics Standards Association) enabling compatibility between displays and mounting hardware. |
— End of Document —
For technical inquiries, contact: solutions@company.com