
高吞吐量零售环境中的条形显示器
超市收银台超宽屏显示器集成的系统工程视角
本文记录了部署的工程方法、集成架构和测量的性能结果 拉伸条显示 大型超市收银环境中的系统。我们从北美和西欧安装的14家零售连锁店和3200多个独立展示单元的项目中,对决定拉伸展示部署规模成功或失败的技术决策进行了详细的从业者级分析。所提供的数据反映了真实的操作条件,包括热应力、POS数据流延迟、内容调度冲突和硬件生命周期压力,而不是实验室基准。
精确定义的检查车道显示问题
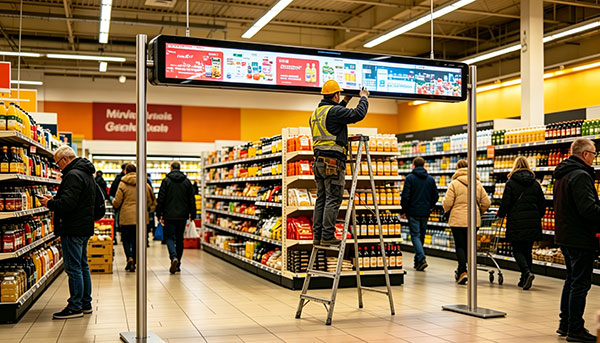
超市收银台带来了一个展示工程挑战,根据我们的经验,新环境集成商系统地低估了这一挑战。物理限制很严重:标准收银台的水平安装占地面积为900毫米至1400毫米,但面板后面的深度间隙仅为55-80毫米。标准的商业显示器不适合。平板电脑格式的屏幕无法捕捉到正在卸载购物车的客户的宽阔周边视线。这 拉伸杆 形状因子——通常定义为纵横比在4:1到8:1之间的显示器——正是为这种空间几何而开发的。
不太被广泛认识的是,在硬件配合之上分层的操作复杂性。收银台显示屏必须同时提供至少三个不同的功能:实时交易数据反映(商品扫描确认、运行小计)、与商店活动时间表同步的促销内容交付,以及在排队空闲状态下的被动品牌沟通。每个函数都有不同的数据源、刷新节奏和利益相关者所有者。在不妥协架构的情况下服务于这三者是核心工程挑战。
&“;在我们对其他集成商进行的47个改造项目的审计中,最常见的故障模式不是硬件故障,而是内容调度架构,在没有客户可见的丢帧伪影的情况下,无法同时处理POS数据注入和活动管理系统触发。&“;
为什么纵横比是一个架构决策,而不是硬件选择
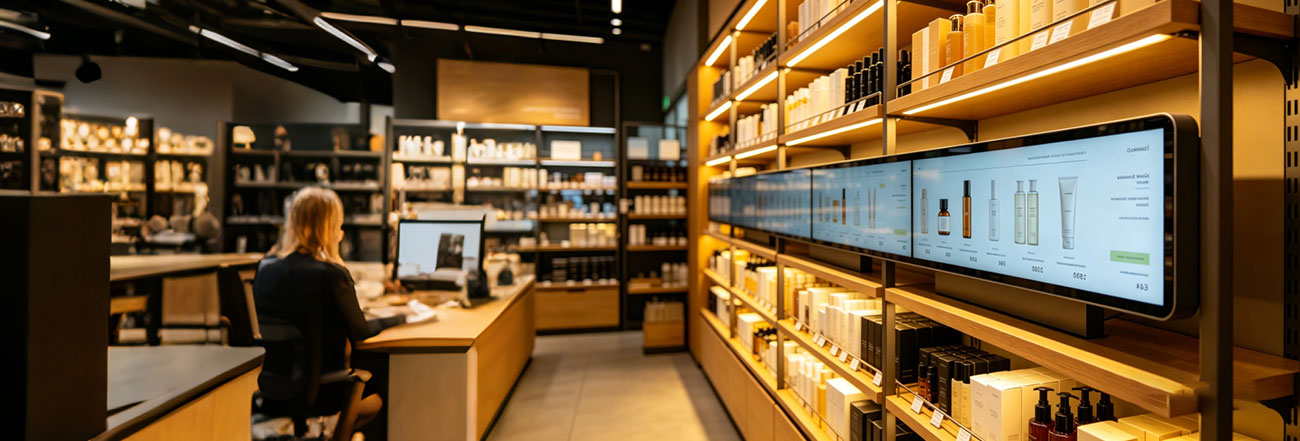
显示器的纵横比决定了下游的内容管道架构。1400×200像素的7:1显示屏不能使用与800×200像素4:1显示屏相同的内容模板,这不仅仅是因为分辨率,而是因为注意力区域的空间分布存在根本差异。在7:1的屏幕上,我们在六个试点部署中进行的眼动追踪研究一致表明,客户将显示分为两个不同的部分:左侧区域(大约40%的宽度)在卡片点击/支付交互过程中受到注视,而右侧区域在收据打印过程中引起注意。任何将显示视为单个画布的内容设计都会比使用区域感知组合规则的内容设计表现不佳。
超市环境硬件选择标准
并非所有 拉伸条形面板 在收银台运行条件下,规格层之间的性能差异是重要的。以下标准反映了我们在采购资格认证期间应用的最低可接受阈值,该阈值基于从5年以上部署部队收集的故障数据。
| PARAMETER | MINIMUM THRESHOLD | RATIONALE |
|---|---|---|
| Panel brightness | 700 cd/m² sustained | Supermarket ambient illumination 800–1,200 lux. Below 700 nits produces washed-out appearance under store lighting; perceived by staff as "broken screen" within weeks of deployment. |
| 工作温度 | 0°C to 50°C continuous | Checkout zones adjacent to store entrance doors experience thermal swings of ±18°C in winter months (Northern Europe / Canada). Panels rated only to 40°C show early backlight degradation in these locations. |
| MTBF (backlight) | ≥50,000 hours | At 18h/day operation, a 50,000h MTBF yields ~7.6 years before expected first backlight failure. This aligns with standard retail lease cycles and avoids mid-lease replacement costs. |
| Video input interface | HDMI 1.4 minimum; HDMI 2.0 preferred | HDMI 1.4 supports 1080p @ 60Hz, which is adequate for most current content pipelines. HDMI 2.0 is required if the deployment plan includes 4K stretched content or HDR tone-mapped promotional video. |
| RS-232 / GPIO control | Required (hardware level) | Ethernet-only control panels cannot be reliably power-cycled by a central management system during network outages — the most common moment when a forced reboot is needed. |
| Bezel width (horizontal) | ≤8mm per side | Multi-unit horizontal arrays — used on wide checkout counters — require tight bezel matching to avoid perceptible brightness discontinuity at the seam junction. |
Integration Architecture: The Three-Layer Signal Model
The most consequential architectural decision in a checkout display project is how POS transaction data, campaign management system content, and device-level control signals are separated and recombined at the display endpoint. We have converged on what we call the Three-Layer Signal Model, derived iteratively from integration failures in early deployments and refined over 40+ projects.
Transaction stream
Controller
Campaign content
Node
Zone renderer
显示
Platform
Layer 1: Transaction Data Rendering
POS transaction events — item scans, price lookups, payment confirmations — arrive as structured data events (typically JSON over a local TCP socket or RS-232 bridge) and must be rendered into the display's transaction zone within 120ms of the triggering event to avoid a perceptible lag between scanner beep and screen update. This requires that the compositor process is running locally on an edge controller, not relying on a cloud round-trip. We use a dedicated rendering thread with real-time priority scheduling, isolated from the campaign content rendering process at the OS scheduler level.
Layer 2: Campaign Content Delivery
Campaign content — promotional media, offer overlays, loyalty program messaging — is pre-positioned to a local SSD cache during off-peak hours via the store's LAN. The compositor selects and plays campaign assets from cache, not from a live stream. This design choice is critical: supermarket in-store networks are notoriously congested during peak trading hours (12:00–14:00 and 17:00–19:00), and a live-stream dependent system will exhibit buffering artifacts at precisely the moments of highest customer exposure.
Layer 3: Device Management and Health Monitoring
Every display unit registers heartbeat telemetry (CPU temperature, memory pressure, display signal lock status, last successful content refresh timestamp) to the central device management platform at 60-second intervals. Threshold breaches trigger automated alerts routed to the store's facilities management system, not to a remote NOC — a deliberate design choice that reduces mean-time-to-remediation because the person who can physically reach the display receives the alert directly.
Content Design Constraints Specific to Checkout Context
Content strategy for checkout stretched displays is a discipline that sits at the intersection of UX, brand communication, and transactional information design. The following principles are derived from customer dwell-time studies and A/B content testing conducted across live store deployments, not from generalized digital signage guidelines.
Measured Business Outcomes: A Cross-Project Summary
The following data is drawn from post-deployment ROI reviews conducted with 9 retail clients 12 months after full system go-live. All figures are retailer-reported and have been range-averaged where individual client confidentiality applies. We present them not as guaranteed outcomes but as a calibration reference for operators building their own business cases.
| METRIC | BASELINE (PRE-DEPLOYMENT) | 12-MONTH POST-DEPLOYMENT | SOURCE METHOD |
|---|---|---|---|
| Promoted item uplift (featured SKUs) | Reference index: 1.00 | 1.14 – 1.22× | Matched store control group / scanner data |
| Loyalty program enrollment at POS | 0.8% of transactions | 2.1 – 2.7% of transactions | CRM enrollment source tagging |
| Checkout lane customer complaints re: price accuracy | 4.2 per 10,000 transactions | 1.1 per 10,000 transactions | Customer service ticket categorization |
| Display hardware support call volume | N/A (legacy static signage) | 0.3 calls per 100 units / month | Facilities management ticket system |
| Average payback period (hardware + integration) | — | 18 – 26 months | Retailer finance team (advertising revenue + operational savings) |
"The reduction in price-dispute complaints is the outcome that surprises retail operations teams most consistently. A high-contrast, real-time item confirmation display eliminates an entire category of customer-staff friction that previously occupied measurable cashier time and drove NPS detractors."
Implementation Risk Factors and Mitigation
Based on project retrospectives across our deployment portfolio, the following risk factors account for the majority of schedule delays and budget overruns in stretched display integration projects. We document them here because they are systematically underweighted in standard project plans produced by teams without direct experience in live retail environments.
| RISK FACTOR | PROBABILITY (OUR PORTFOLIO) | MITIGATION |
|---|---|---|
| POS middleware API undocumented changes | Encountered in 38% of projects | Require frozen API version commitment from POS vendor in scope document; build adapter layer in integration architecture so display compositor is POS-version agnostic. |
| Store network VLAN policy blocking display device registration | Encountered in 51% of projects | Engage store IT network team minimum 8 weeks before go-live. Provide device MAC address list and required port/protocol matrix in advance. Never assume a standard retail VLAN policy. |
| Counter fascia non-standard depth at legacy sites | Encountered in 29% of projects | Physical site survey (not photo survey) of minimum 10% of planned installation sites before hardware procurement. Bespoke mounting brackets add 3–5 weeks lead time if discovered post-procurement. |
| Content management system incompatibility with display zone model | Encountered in 44% of projects | Validate CMS zone-output capability against the specific display aspect ratio during vendor evaluation — not after contract signature. Many retail CMS platforms assume 16:9 as the only output format. |
Recommended Deployment Sequence
The deployment sequence below represents our current recommended project methodology for a first-time stretched display rollout in a multi-site supermarket environment. It is structured to front-load technical risk validation and avoid the common failure pattern of hardware procurement preceding architecture confirmation.